


Before diving into which metrics to track, it helps to understand the scale of the platform you're operating on.
YouTube has over 2.7 billion monthly active users and is the second most visited website in the world. Every day, more than 1 billion hours of video are watched on the platform — and 500 hours of new content are uploaded every minute. That's the environment your videos are competing in.
For businesses, the stakes are even clearer: 68% of users watch YouTube videos to inform a purchase decision, 75% use it to discover new brands, and 70% have bought a product after seeing it in a YouTube ad. Meanwhile, 54% of marketers are already active on YouTube, with 66% planning to increase their presence.
None of that reach translates to results unless you understand how your channel is actually performing within it. That's what YouTube analytics is for — not just tracking numbers, but understanding what those numbers are telling you about your audience, your content, and your growth.
In this blog, we’ll break down the key YouTube metrics, KPIs, tools, and tips you need to know.
The thing about YouTube channel analytics is that there are just so many metrics, and honestly, most of them don’t offer much valuable insight.
You don’t want to waste your energy tracking every single one. So here’s a list of the key YouTube metrics that actually matter-
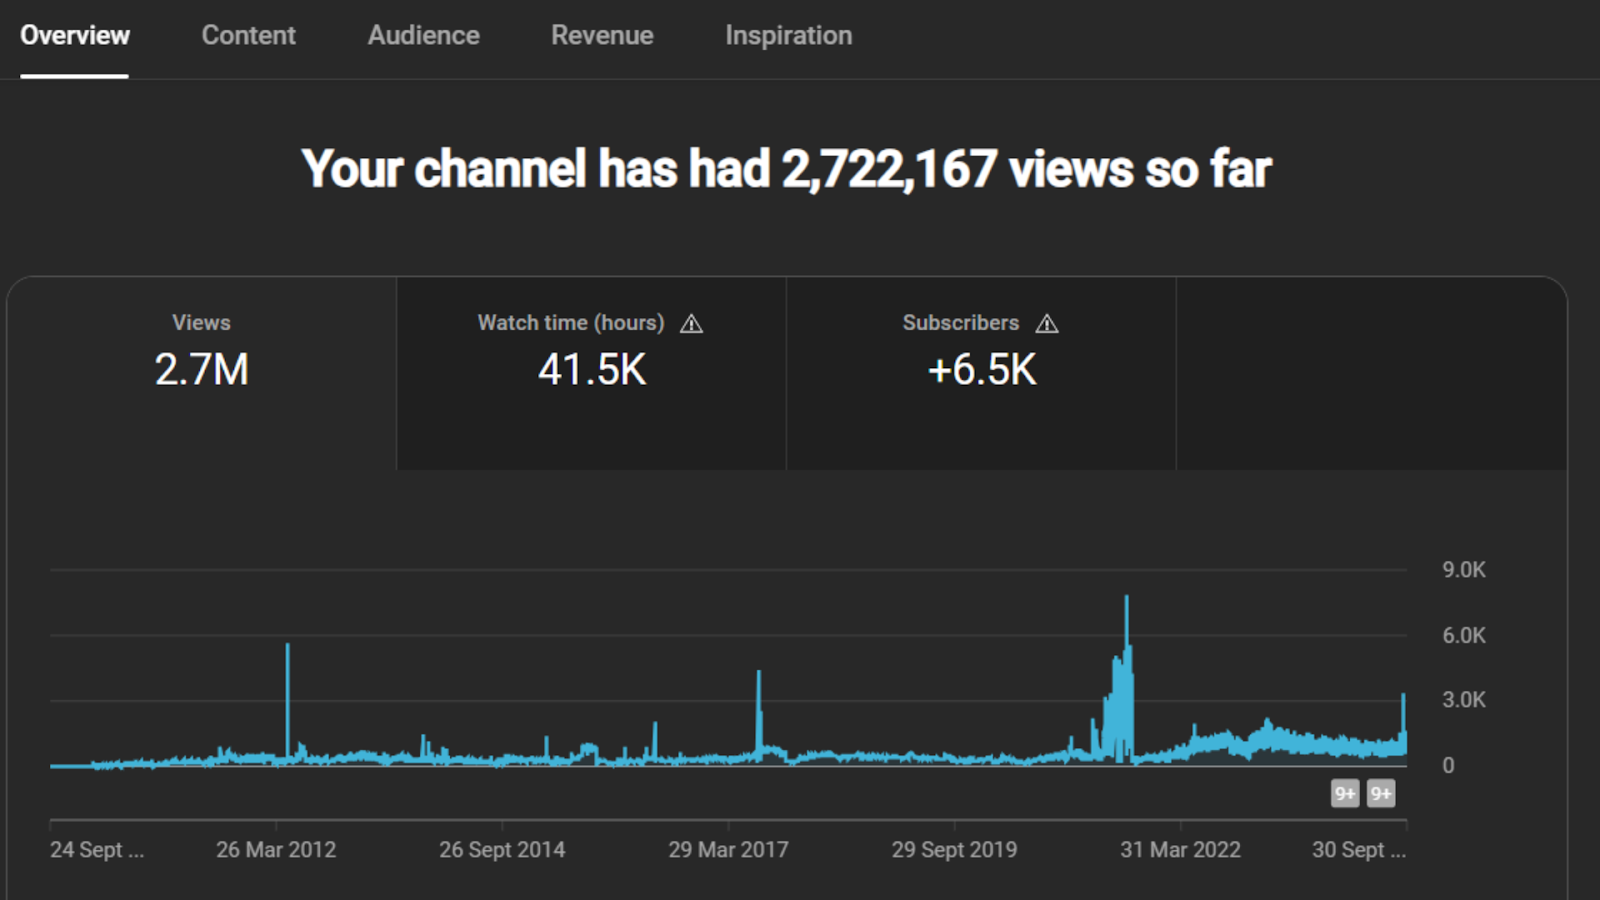
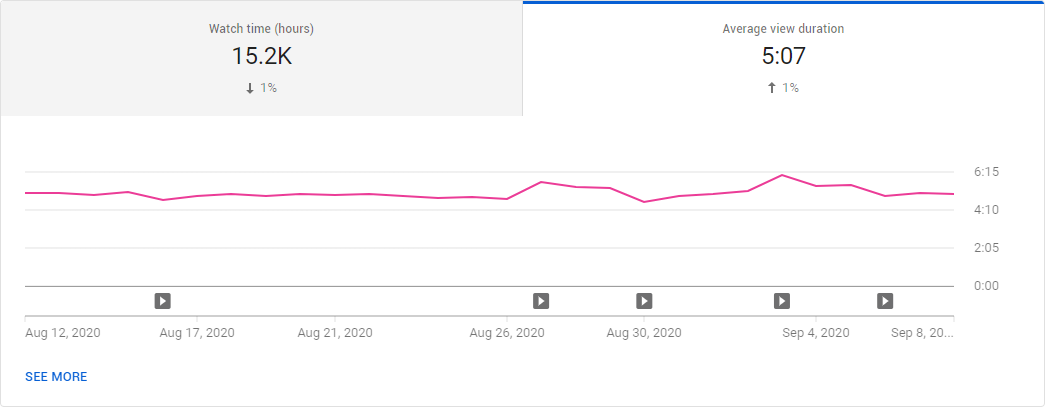
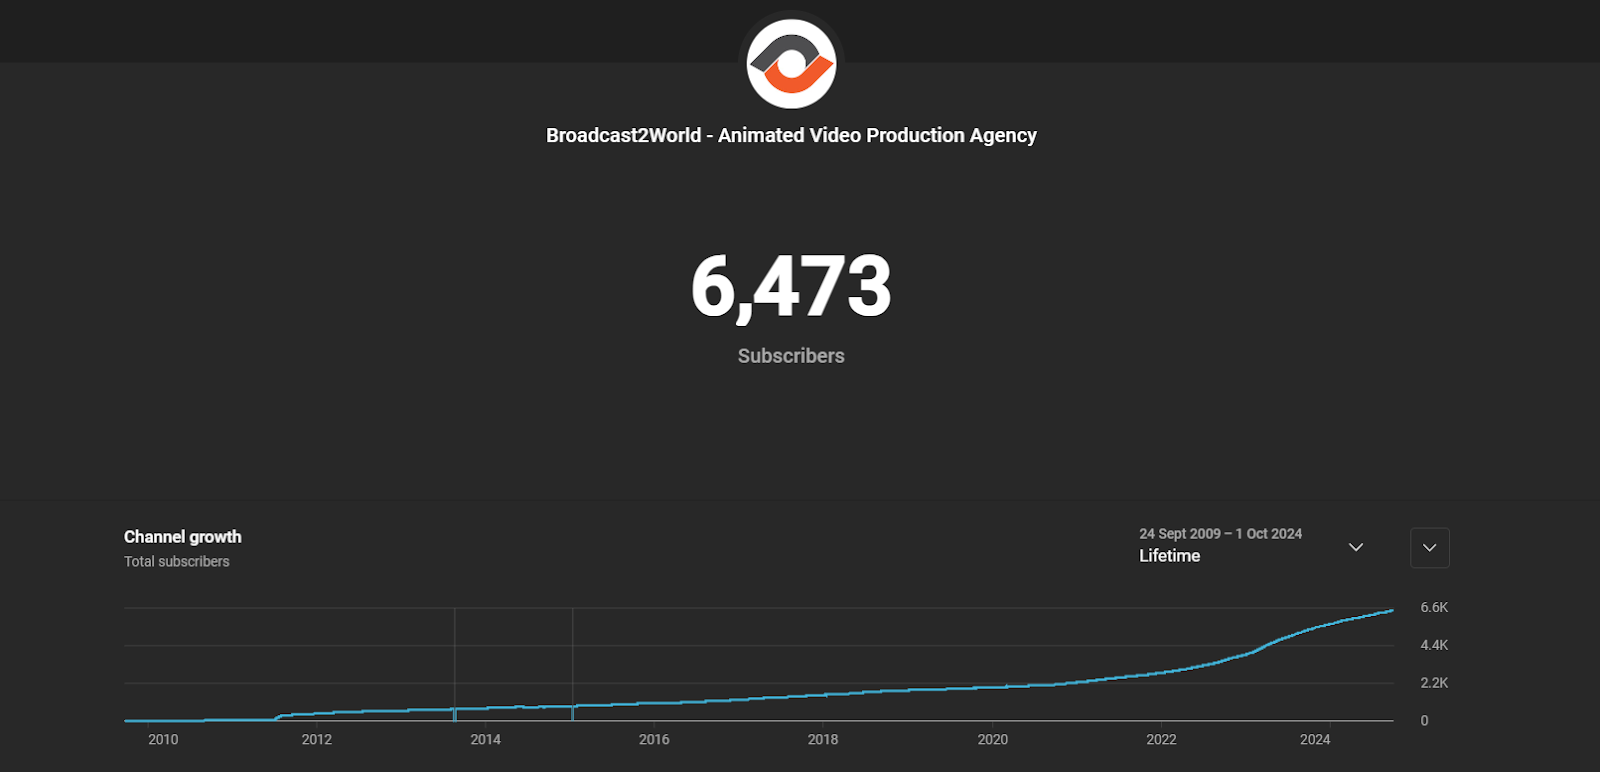
Source: Broadcast2World YouTube Channel
This is a super important YouTube KPI as it measures the total amount of time people have spent watching your videos.
YouTube’s algorithm favors videos with higher watch times, seeing them as more engaging and boosting them in search results and recommendations.
You can use the Watch Time Report to analyze the total watch time for all your videos. To find Watch Time in YouTube Studio, simply go to Analytics, then click on Overview, and select Watch Time.
In the Watch Time report, you can also rank your videos by watch time and group them by length, theme, or style to determine which types keep viewers engaged the most.
Source: Biteable
It shows how much of your video, on average, people actually watch. It helps you measure how well your videos hold attention.
The better your videos are at keeping people engaged, the more likely they are to appear in YouTube search results and recommendations.
Source: TubeRanker
It shows how long, on average, viewers stick around to watch your video. You can calculate the average view duration by dividing the total watch time by the number of video playbacks, including replays. Knowing this metric helps you understand how well your video is keeping viewers engaged.
If the video is not getting the people hooked, they’ll click away quickly, and your average view duration will drop.
You can check this YouTube statistic in your Watch Time report to get a better sense of how engaging your videos really are.
Source: Broadcast2World YouTube Channel
This metric shows the percentage of viewers who stay or leave at any point in your video.
Why does this matter?
Because YouTube loves videos that hold people's attention, and it rewards them by promoting them more. Knowing your audience retention helps you shape a better video strategy.
The parts where viewers stay engaged can spark ideas for your next video, while the dips show you what’s turning them off—so you can cut those parts moving forward.
Once there’s enough data to generate your YouTube’s audience retention report, you’ll have two graphs–
This shows the total number of times viewers re-watch specific parts of your video. If many people are re-watching a certain section, it indicates that the topic you're discussing at that moment is capturing their interest. This could also present an opportunity to create a full-length video on that topic.
You can find data on re-watches in the absolute audience retention graph, where they typically appear as rising curves.

Source: Broadcast2World YouTube Channel
Comments, shares, likes, and dislikes can tell you how your audience feels about your videos.
Comments can show the emotional impact your video has on your viewers, while shares can tell how much people value your content and brand. When people share your video, they’re basically saying that they trust and support your brand publicly.
Likes and dislikes can help you point out the topics that resonate the most with your audience. You can track all of these engagement metrics in YouTube’s Interactions Report.
Source: YouTube Creators
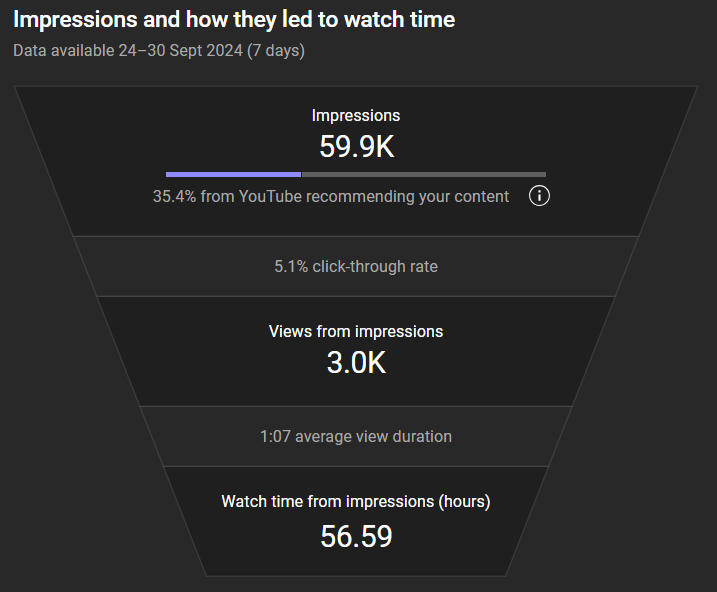
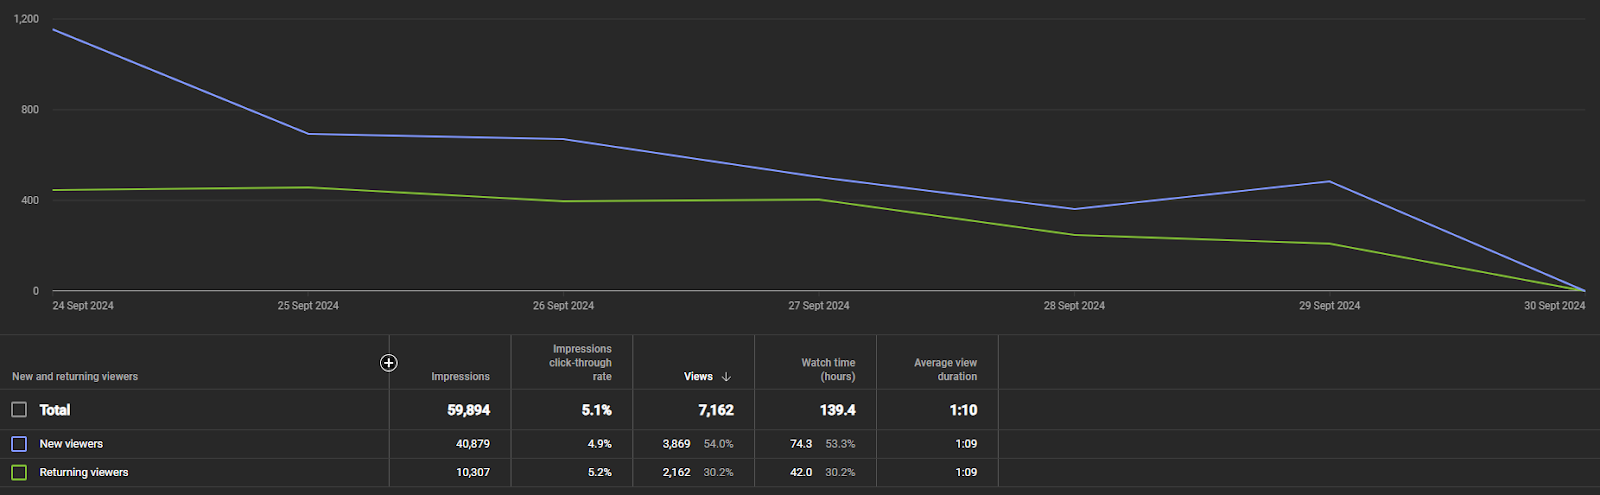
Impressions click-through rate measures how well your video grabs people's attention and gets them to watch after they spot it on their homepage, in recommendations, or in trending sections. A high CTR indicates that your title is catchy and the topic highly resonates with viewers.
Usually, you’ll notice a spike in CTR right after you release a video. This happens because your subscribers are likely to notice it right away. But as it reaches a wider audience, the CTR might dip and then level off.
To better understand how your video is doing, pair this metric with the average percentage viewed and average view duration. This will help you see if people are sticking around once they click.
Now, while a high CTR is awesome, if viewers are bailing right after hitting play, it could mean your title or video thumbnail is misleading. That is why it’s super important to set the right expectations from the start. Don’t make people feel tricked or else they might lose trust in what you’re sharing.
On the other hand, if you have a low CTR but high engagement, it could mean your video has a smaller but super dedicated audience that really connects with your content.
So, keep focusing on creating valuable content to maintain this quality audience, and consider using the best YouTube thumbnail fonts to boost your CTR!

Source: InVideo AI
Cards are those handy slide-in panels that appear during your videos and encourage the viewers to take action—like subscribing to your channel, checking out another video, or visiting a different website.
By analyzing the click-through rates for each card, you can figure out what your viewers are really into. This helps you place the most appealing cards in your videos, which can boost your watch time, grow your subscriber count, or drive more traffic to your website.
Plus, understanding when and where viewers click on these cards can help you figure out the best timing and placement for future videos.
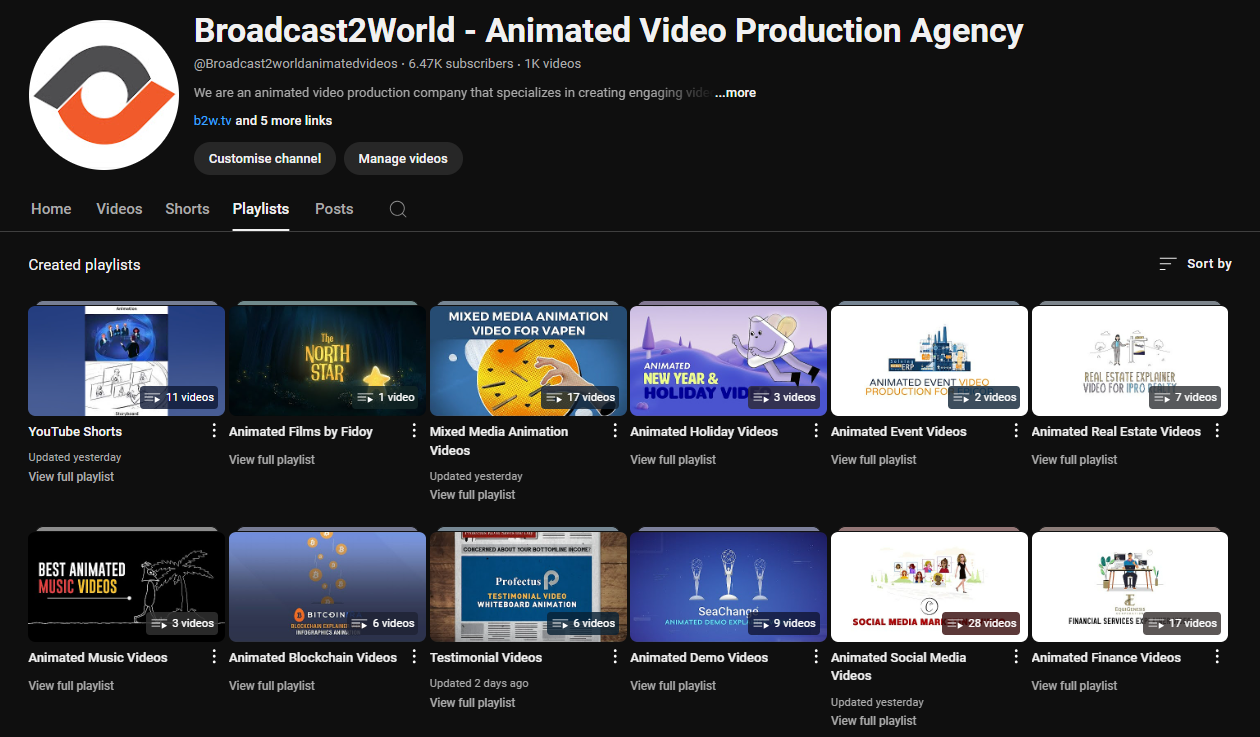
Playlists let you organize your videos, making it easier for the viewers to find and enjoy content on their favorite topics. This way you can keep them engaged and boost your channel's watch time at the same time.
To understand how well your playlists are doing, check out two key metrics in YouTube’s Playlist Report—
If these metrics aren’t looking great, you can consider kicking off your playlist with videos that have the highest retention rates. This way you’ll be able to grab attention right from the start!
Source: RecurPost
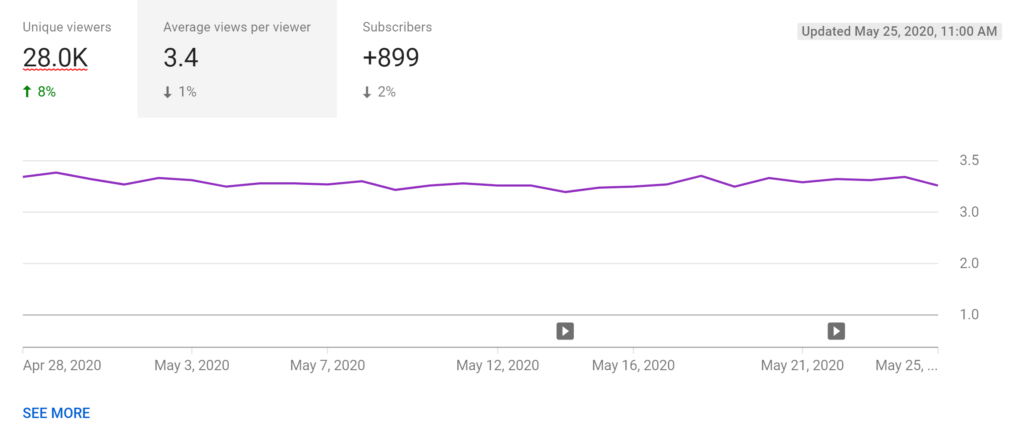
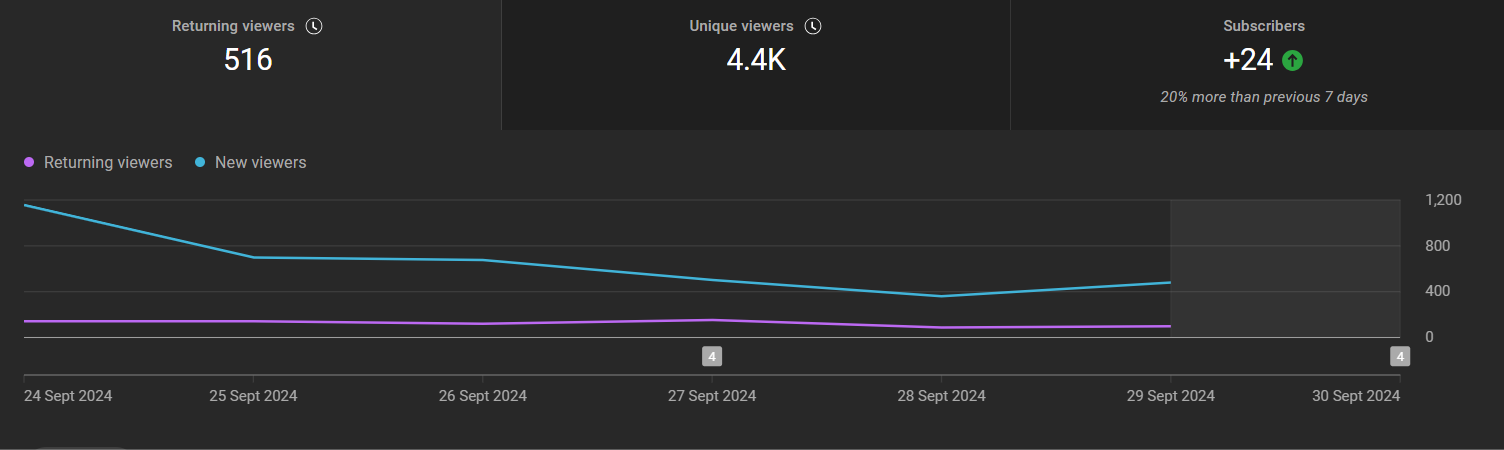
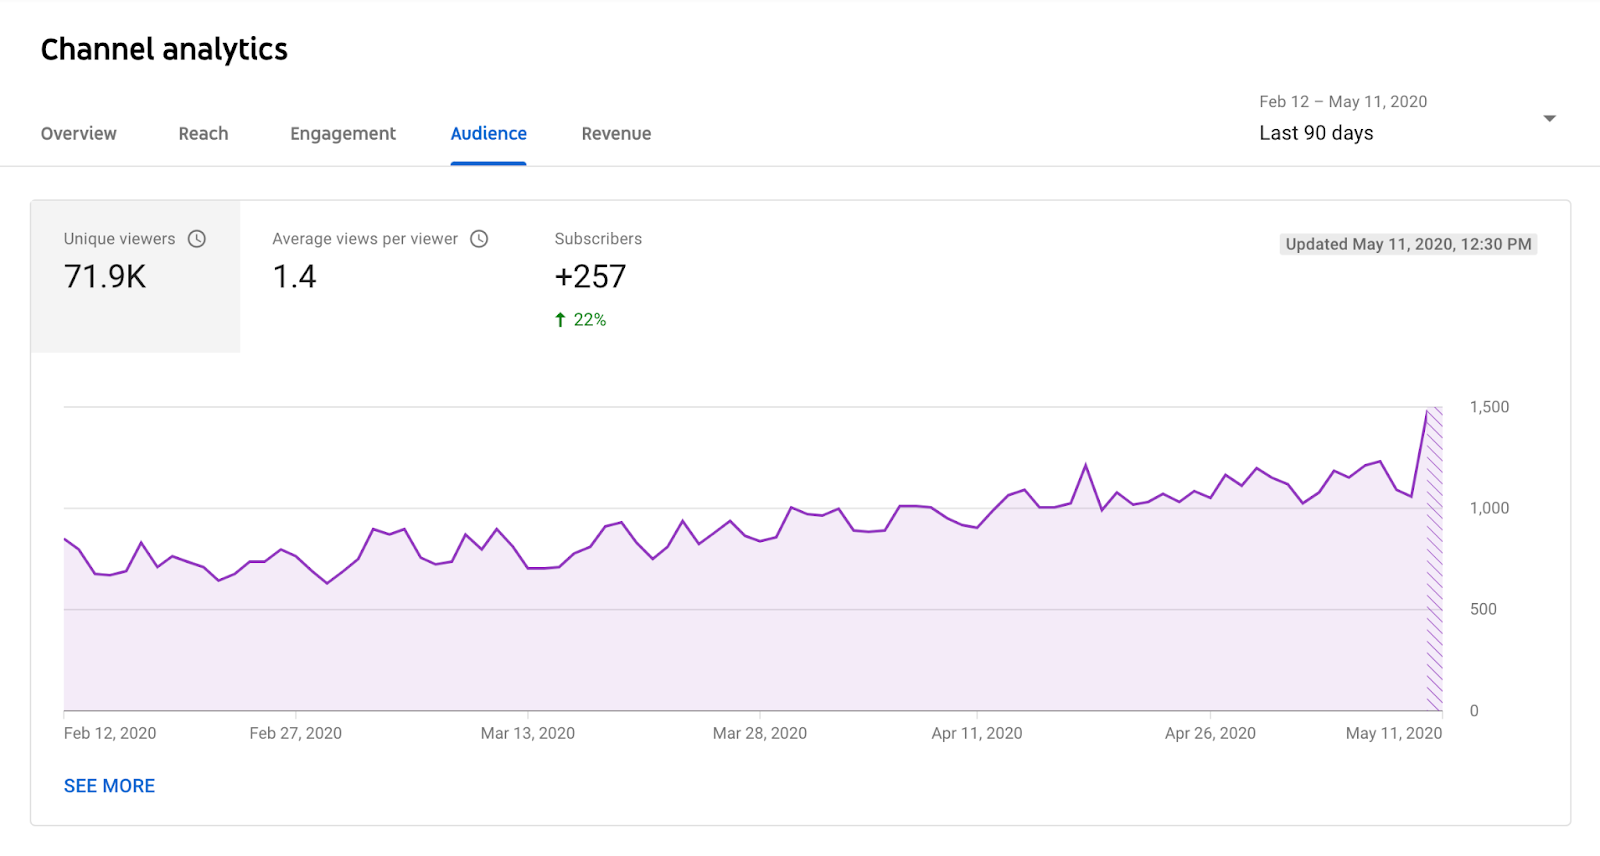
This is an important Key Performance Indicator (KPI) that shows you how many different people are tuning in to your videos over a certain period. It gives you a more accurate idea of your actual audience size.
It also helps you figure out how engaged your subscribers are. If you notice that your unique viewers are lower than your subscriber count, it might mean that not everyone is catching your videos.
To get more subscribers watching, remind them to turn on notifications for your new uploads.
You can find this unique viewer metric in the Reach and Audience section of YouTube Studio.

Source: Broadcast2World YouTube Channel
Now this metric indicates how many times, on average, each person watches your video. It shows whether your content is so engaging that viewers want to re-watch it.
If you see high views per unique viewer, it indicates that your video topics resonate well with your audience. So, focusing more on these types of topics can help you attract even more view count, increase watch time, and gain new subscribers.
Source: Broadcast2World YouTube Channel
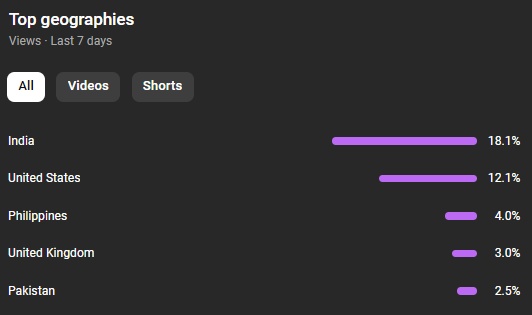
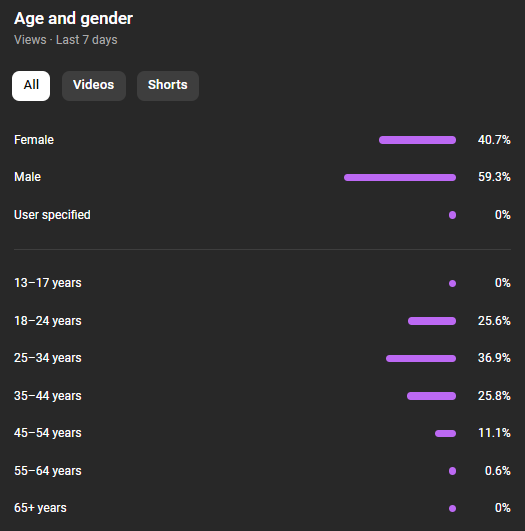
YouTube’s demographics report can help you understand who’s watching your videos, breaking it down by age, gender, and location.
Source: Broadcast2World YouTube Channel
This information can help you identify your most engaged viewers and who you should be targeting.
If you find that you’re not reaching your target audience, consider adjusting your video marketing strategy to cover topics that would appeal to them.
Source: Broadcast2World YouTube Channel
Your subscribers are super important—they have publicly committed to your brand, content, and values.
Whenever you upload new videos, YouTube sends them notifications and features your content on their homepage, helping you get more views.
Plus, subscribers tend to watch twice as much as non-subscribers, so the more subscribers you have, the more watch time your videos will rack up.
You can check out YouTube’s Subscribers Report to see which videos, locations, and timeframes are bringing in or losing subscribers. This info is literally gold for figuring out what topics your audience loves and how to attract new viewers.
By paying attention to what your subscribers really want, you’ll be able to create content they crave, boost your watch time, and, as a result, climb those search rankings!
Source: YouTube Creators
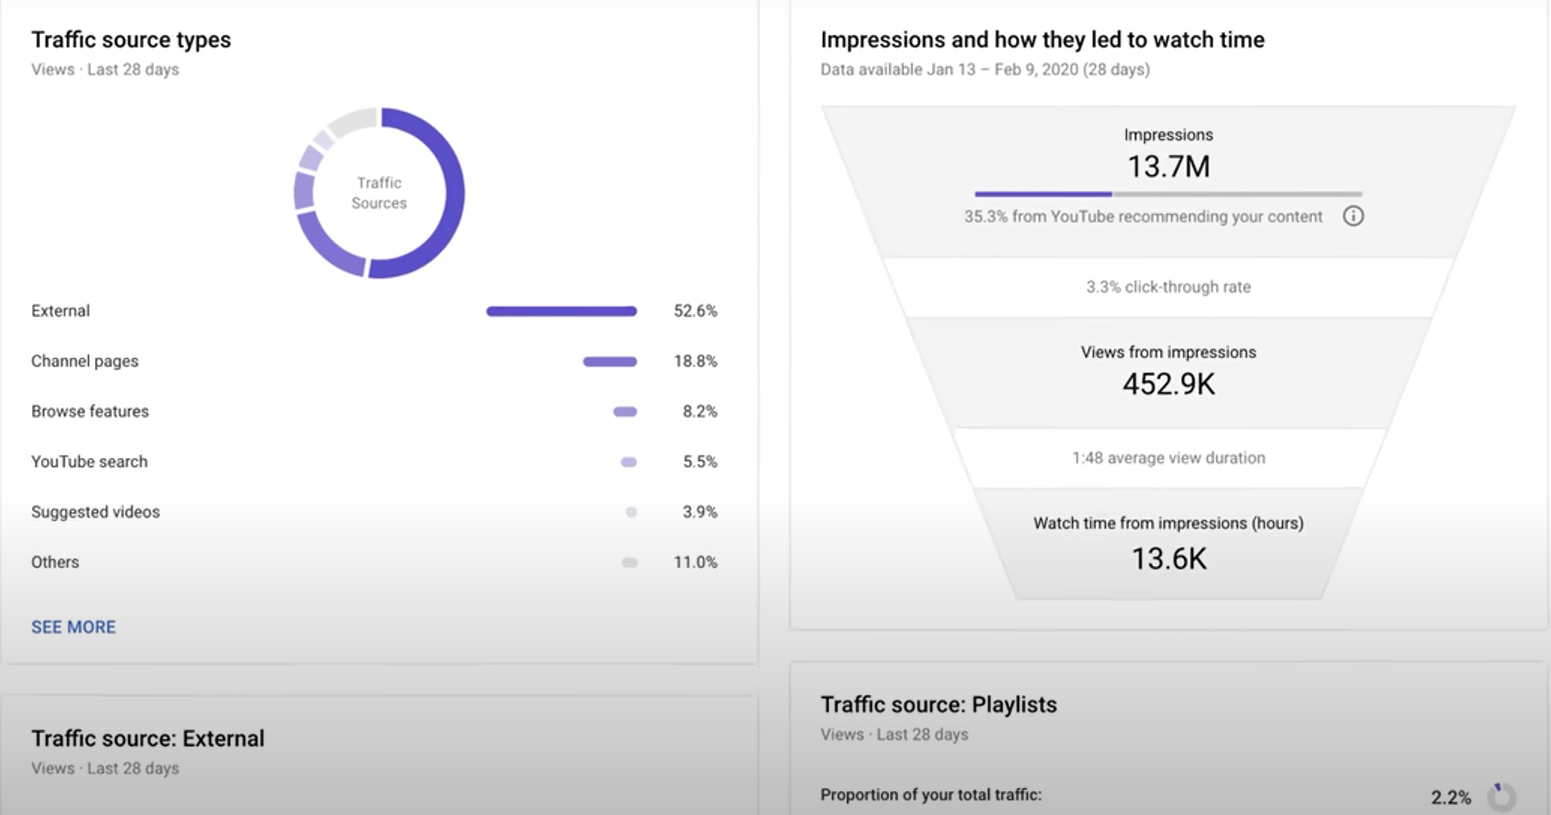
External referrals, like social media videos or websites that embed your videos, along with YouTube referrals from search results, the recommended section, and the homepage, are all important traffic sources.
The Traffic Sources report helps you see how viewers discovered your videos and which sources bring in the most views and watch time. You can use this information to fine-tune your video promotion strategy and get better results.
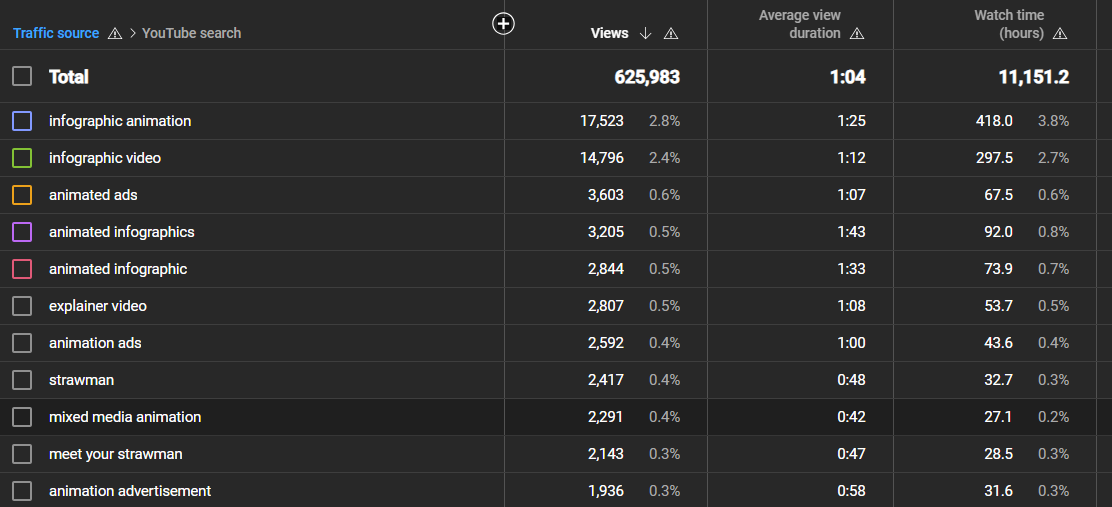
Source: Broadcast2World YouTube Channel
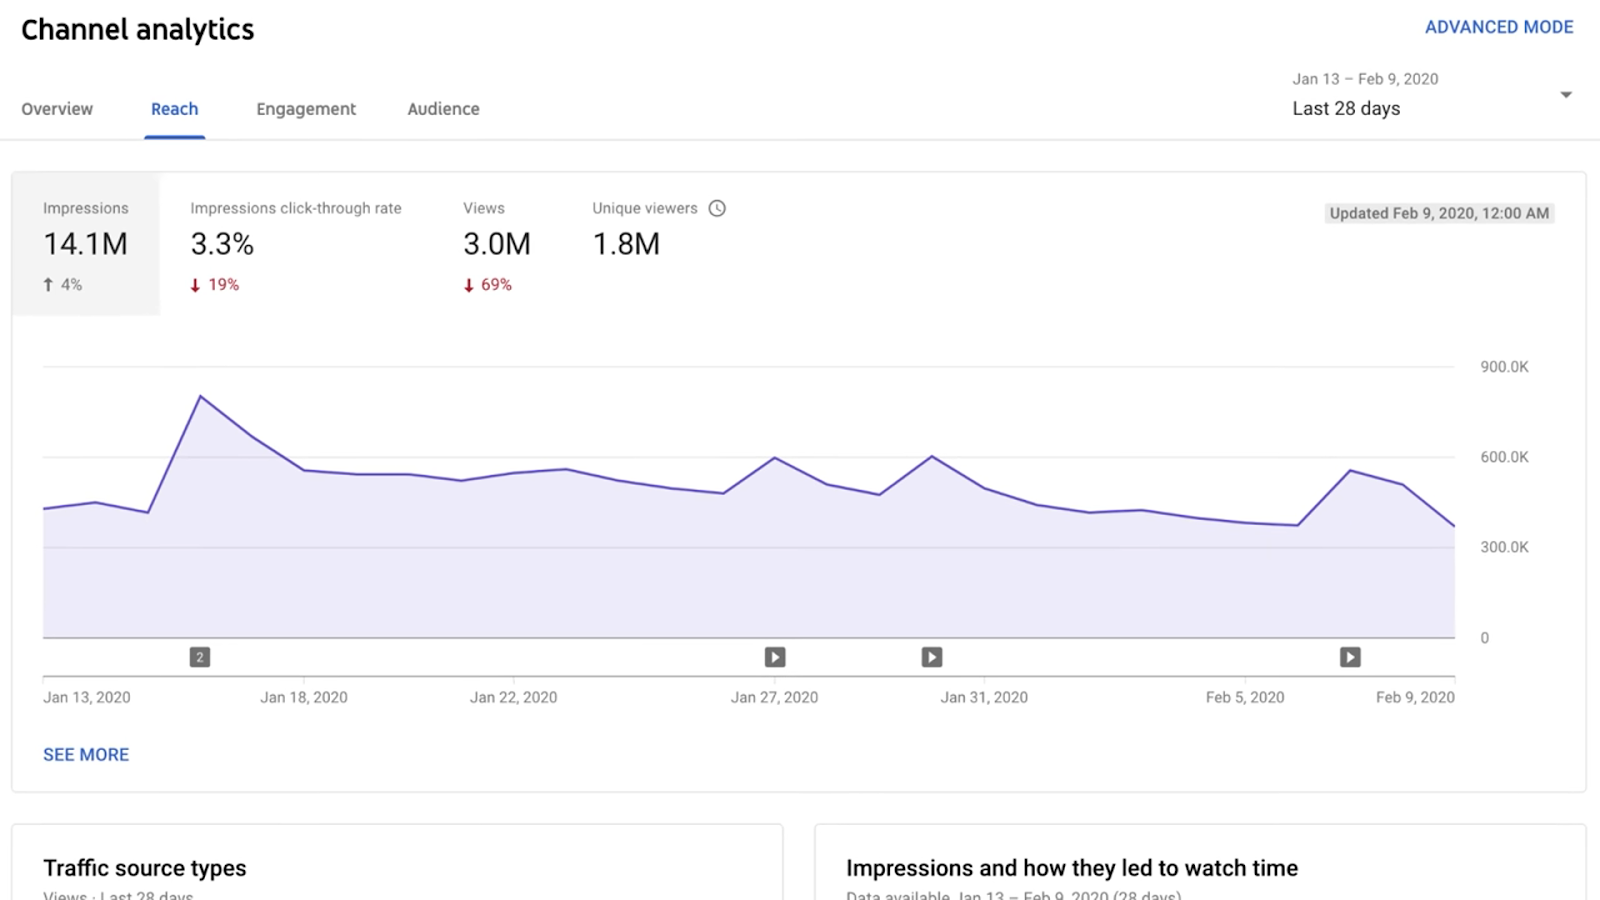
You can use YouTube's Reach Report to see which search queries are leading viewers to your videos.
If these queries are somewhat related but not exactly aligned with your video's topic, you can update your video to cover those content gaps and add the relevant keywords to your metadata.
However, if the queries are very different, it might be a good idea to create a new video specifically focused on those popular searches.
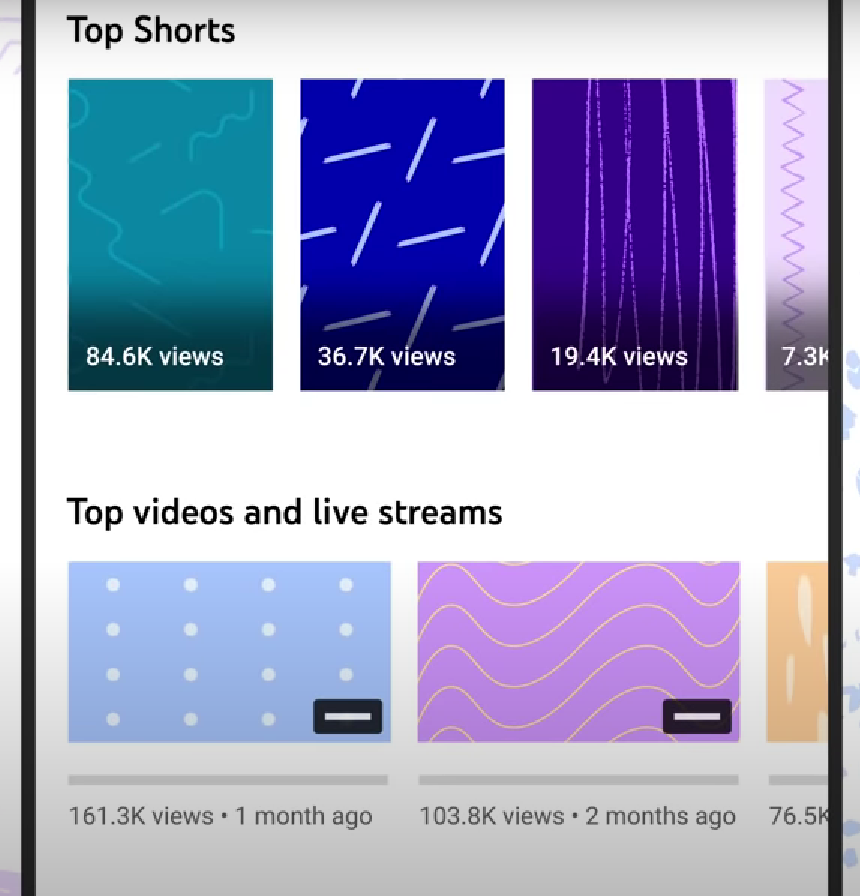
Source: YouTube Creators
This YouTube channel analytics highlights your top video content based on views over a specific period.
If you want to see which videos have really been your all-time best performers, just change the time frame to 'Lifetime
Source: YouTube Creators
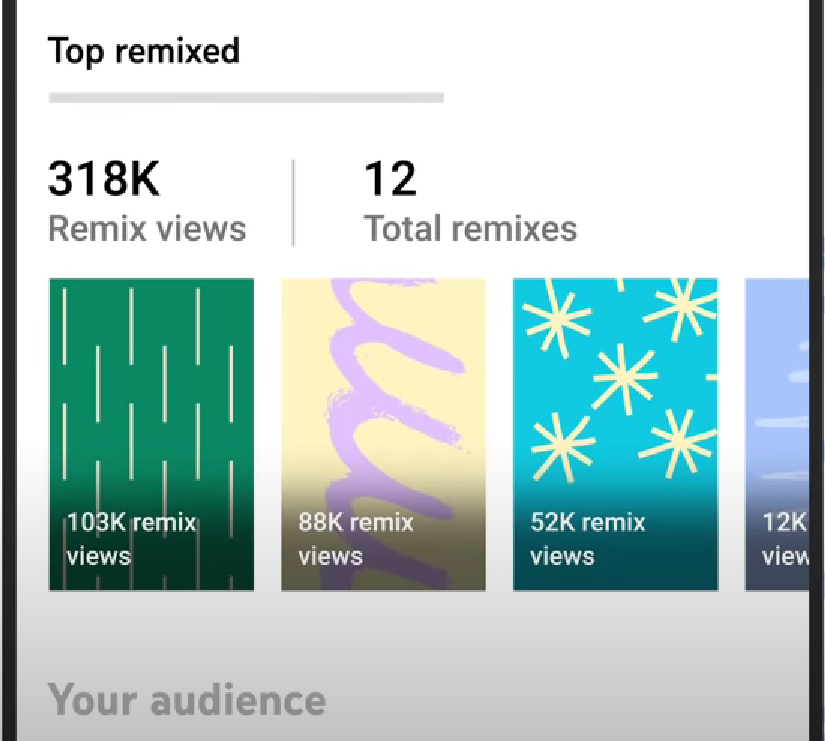
This metric shows how often your YouTube channel’s content is being remixed or used in Shorts, along with the number of views those remixes get.
Remixes can boost your channel's visibility and increase your video views since they include tags that direct traffic back to your channel.
These are all the major metrics and KPIs you should know about. Now, let’s also explore the YouTube analytics tools that will help you track them.
There are plenty of YouTube analytics tools out there, but these are some of the best ones worth checking out.
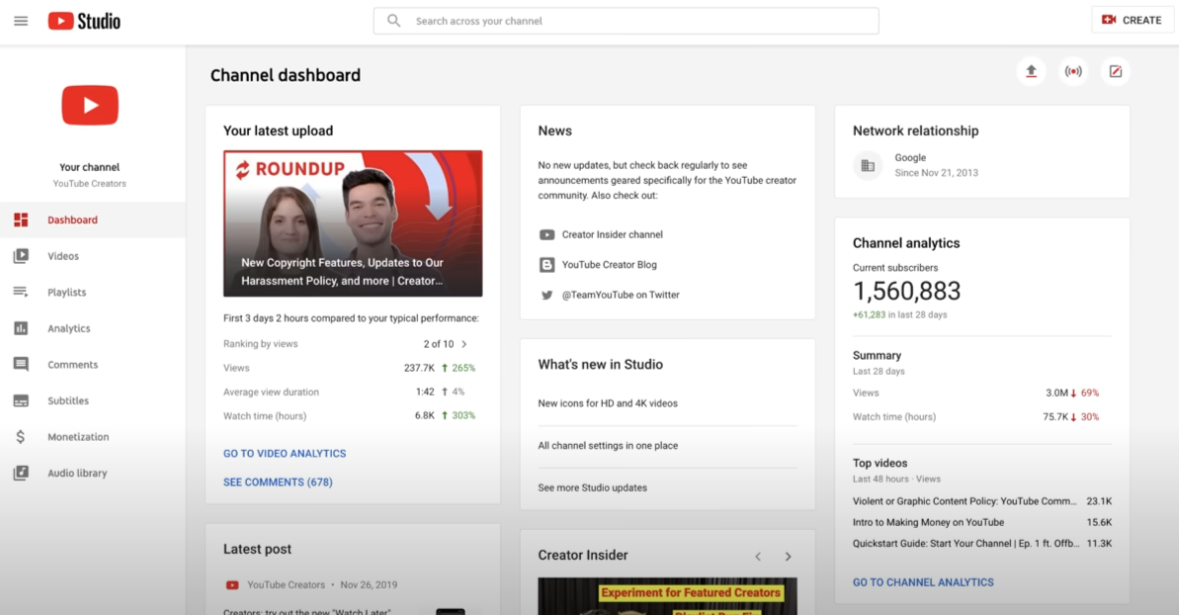
Source: YouTube Creators
YouTube Studio is your one-stop shop for all things analytics on YouTube.
Its features can come in handy if you're focused on growing your channel, rather than just trying to fit YouTube into your bigger social media plan.
One of the coolest parts about this tool is its Advanced Mode, where you can really dig into the data. You can compare how different videos are performing, export your findings, and uncover all sorts of insights.
If you're part of a marketing team, this mode is like a treasure chest of valuable information!
Some of YouTube Studio’s most important offerings are-
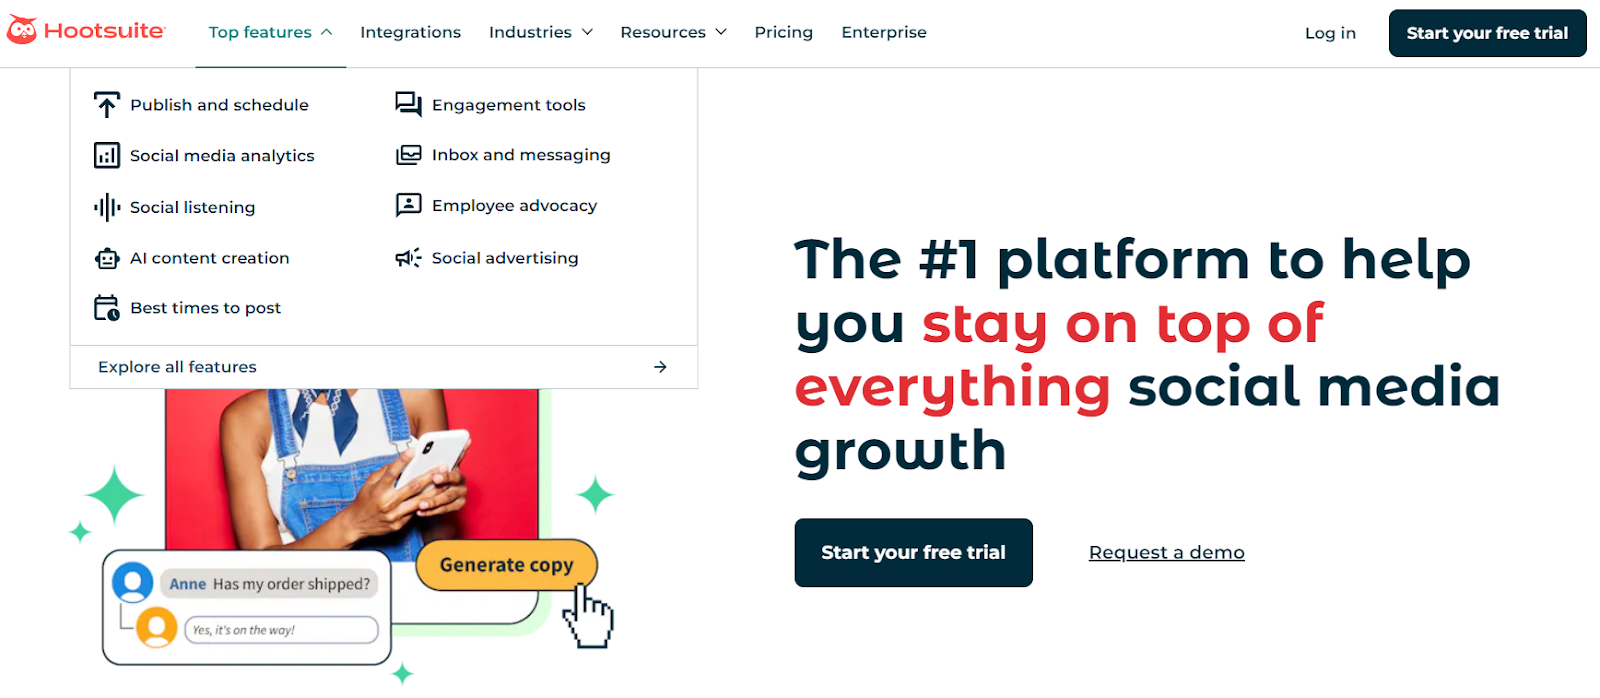
Source: Hootsuite
Hootsuite is a super useful tool for social marketers who want to see how YouTube stacks up against their other social platforms.
You can pull YouTube into its own report, but the real beauty is being able to compare key YouTube metrics with your other social accounts all in one place.
This makes it especially helpful when you need to present results to senior stakeholders who want a clear, big-picture view of your social media performance.
The best part about Hootsuite is that it keeps it simple and shows all the important data on one easy-to-navigate screen.
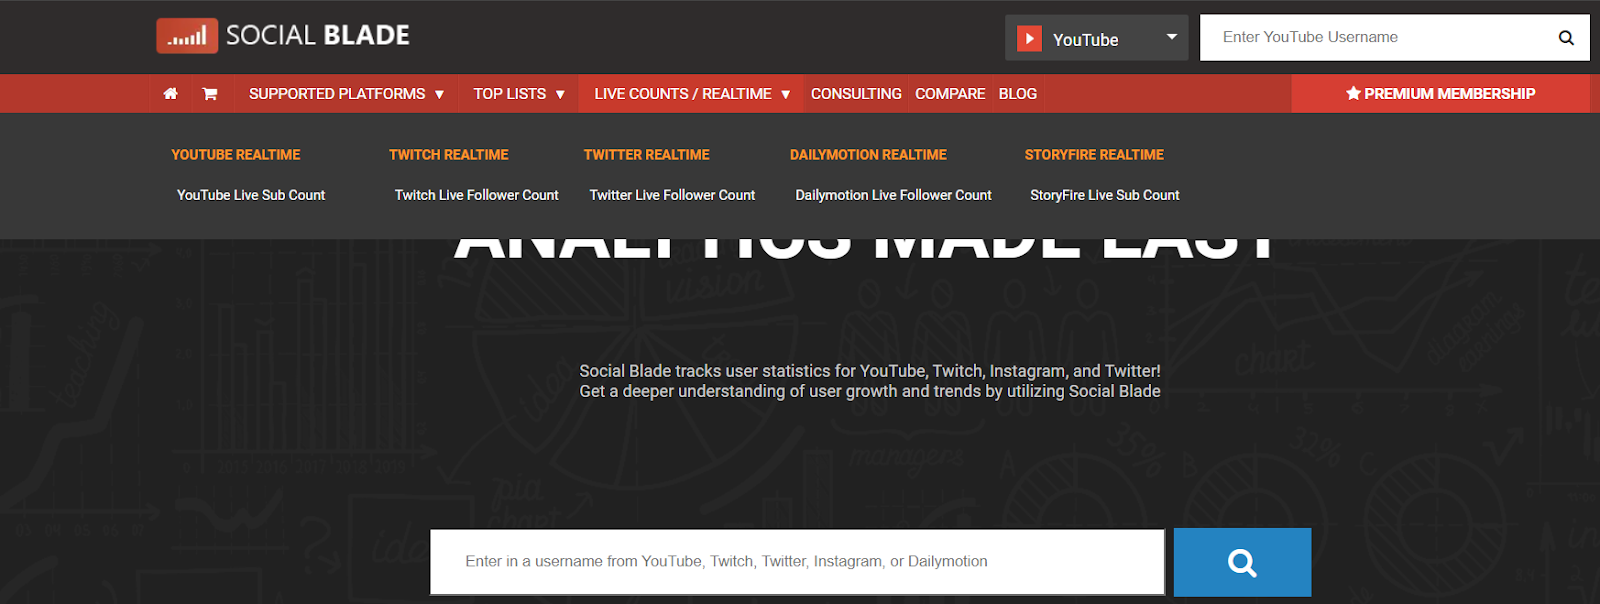
Source: Social Blade
Social Blade gives you a quick look at key stats like views, subscribers, growth rate, and even estimated revenue for any public YouTube channel—including your own.
They also have browser extensions that let you see these numbers while you watch YouTube videos.
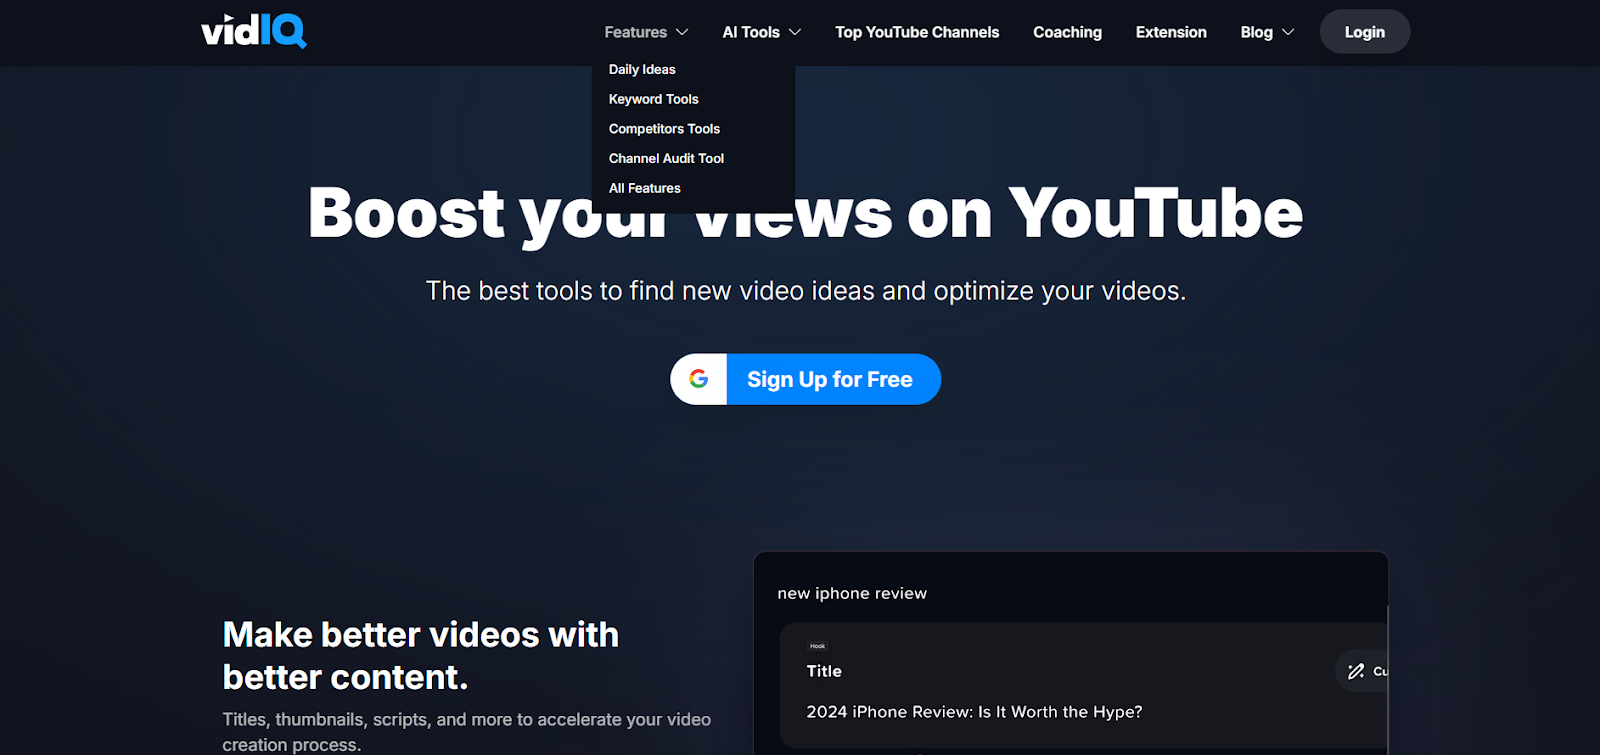
Source: VidIQ
VidIQ is a third-party tool that helps you access metrics not available directly on YouTube.
It shows views per hour and even lets you pull analytics about your competitors' channel performance.
Plus, it offers features to boost your channel, like SEO recommendations for improving your video titles and descriptions.
If you're interested in mastering Video SEO Optimization, be sure to check out this linked blog!
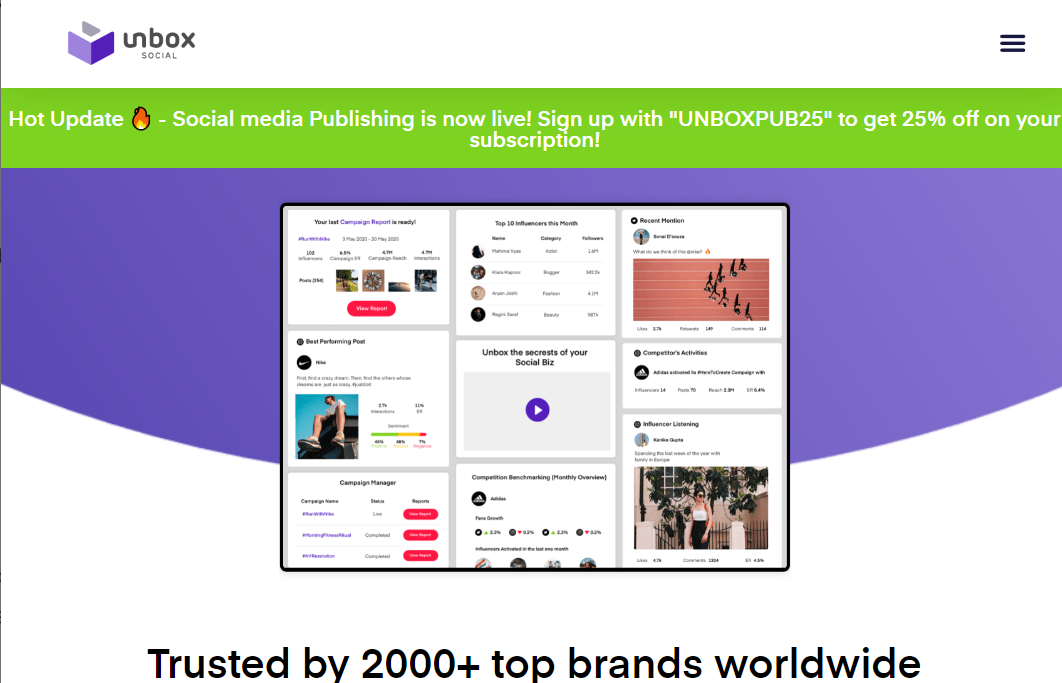
Source: Unbox Social
Unbox Social gives you a complete breakdown of how your YouTube channel is performing. It helps you understand which posts are being loved by your audience and which ones aren’t hitting the mark.
You can also track your subscriber count, seeing how many people are joining or leaving, which gives you a better sense of your channel’s growth.
Plus, it digs into your audience’s demographics so you can adjust your strategy to better connect with them.
Unbox Social also lets you monitor changes in your video views, making it easy to spot any spikes and figure out which video caused the boost.
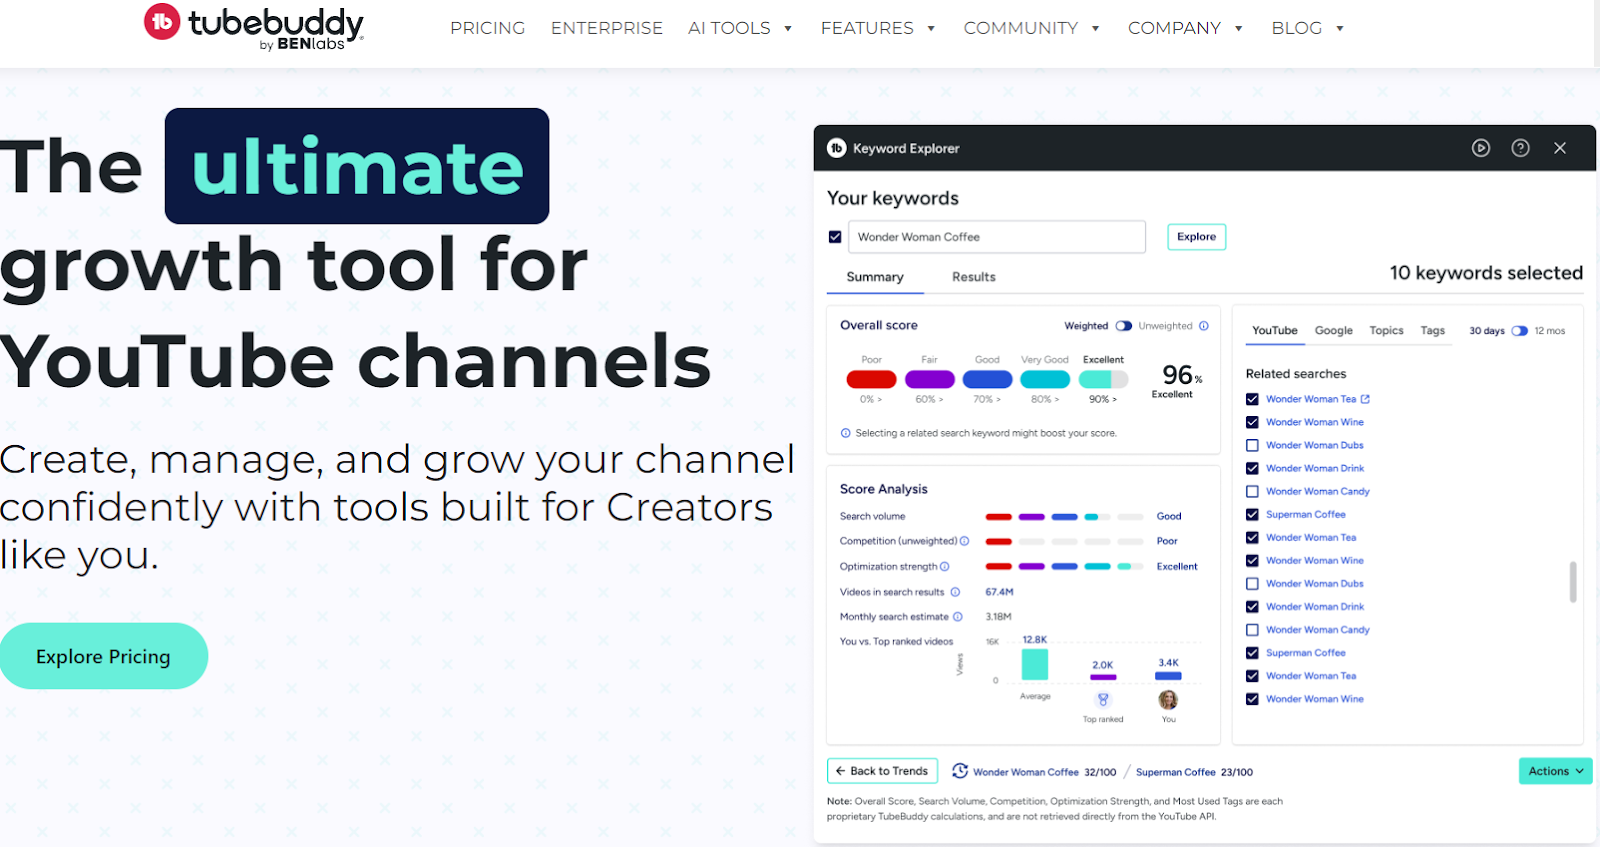
Source: TubeBuddy
TubeBuddy provides you with an easy-to-use dashboard to check your channel analytics.
It includes a comparison graph to help you analyze how your video content from the past 30 days stack up against your competitors.
Its ‘Competitor Scoreboard’ helps you compare other metrics like uploads, views, and subscribers.
Additionally, it includes a ‘Videolytics’ tool that lets you research your competitors and see what’s working for them and what isn’t.
Aside from these options, you can also check out other tools like Quintly, ChannelMeter, ViralStat, and Tubular Intelligence.
To make the most of your YouTube analytics and improve your content strategy, here are some practical tips you can follow-
Source: Freepik
Pay keen attention to essential metrics like watch time, views, subscriber growth, and engagement rates.
These numbers give you an accurate picture of how well your channel is doing and how your audience is interacting with your content.
Find out where your views are coming from—Is it from search, social media, or recommendations?
Understanding this insight will help you tailor your YouTube marketing strategies and optimize your content for the most effective platforms.
Look at audience demographics to learn about the age, gender, and location of your viewers. You can use this information to make content that correctly aligns with your audience’s preference.
Check how viewers are interacting with your videos. Do you notice any patterns in likes, comments, and shares to see?
Decipher these patterns to learn what really resonates with your audience.
Source: Freepik
Analyze when your viewers are most active on YouTube and then schedule your uploads during these peak times.
This will increase your likelihood of gaining more visibility and engagement.
Dive into the analytics for individual videos to understand what works best.
Make use of the Reach, Engagement, and Audience tabs for each video to assess their content performance.
Regularly review changes in subscriber growth and video performance over time.
If you notice any significant shifts, look into possible causes like changes in posting frequency or specific video performance.
Use YouTube Studio's built-in tools for real-time analytics, audience demographics, and revenue tracking.
Using this comprehensive view, you can make quick adjustments based on current data.
Consider using tools like VidIQ or TubeBuddy for additional analytics features, such as competitor analysis and SEO recommendations, to enhance your channel's visibility.
For more advanced research, reliable datacenter proxy services can help you securely access geo-restricted content or view competitors’ channels from different regions, giving you a broader perspective on audience targeting and trends.
Source: Broadcast2World YouTube Channel
If certain videos perform well in search, add them to playlists to boost their visibility and encourage viewers to watch related content.
By following these simple yet effective tips, you can ace YouTube analytics.
Pay particular attention to the Revenue tab — a sudden drop here is often the first signal of demonetization, which is worth understanding separately.
A sudden drop in the Revenue tab is often the first sign of demonetization — when YouTube removes a video's or channel's ability to earn ad revenue because the content doesn't meet advertiser guidelines. Your monetization icon turns gray, and future earnings stop (anything already earned stays in your account).
Copyright violations, sensitive or controversial topics, misleading thumbnails, reused content, and advertiser-unfriendly language are the most frequent causes. YouTube tightened these rules significantly after the 2017 Adpocalypse, when advertisers pulled spend over brand-safety concerns.
Go to YouTube Studio → Content → Monetization to confirm which video is flagged and why. If the issue is fixable — unlicensed audio, a misleading title, an overly graphic thumbnail — address it before submitting an appeal. Appealing without fixing the root cause rarely succeeds.
To appeal: open the flagged video → click Appeal under Restrictions → submit your reason referencing the relevant policy. Manual reviews take time; resubmitting multiple times won't help.
Ad revenue is one layer. Sponsorships, channel memberships, affiliate partnerships, merchandise, and income generated through digital products like courses or templates are all unaffected by demonetization status — and having even one of these in place means you're not entirely dependent on YouTube's review timeline.
It's also worth understanding which highest rpm niches on YouTube generate the strongest ad revenue — if a niche pivot is viable, it can significantly improve your baseline earnings before demonetization becomes a concern.
YouTube analytics helps you see the data and performance metrics of your channel. Using metrics like views, watch time, comments, and subscribers, shows you what type of content your audience likes and what it doesn’t.
Without tracking YouTube analytics, you won’t know these insights and won’t be able to effectively engage your audience with your videos. Not only that but many other benefits of YouTube analytics make it super important. Some of them are mentioned below–
There is no one-size-fits-all benchmark for YouTube content; you need to create content that your audience likes. YouTube analytics show you what your audience prefers.
For example, do they prefer longer videos or quick YouTube Shorts? Does engagement spike when you post less often?
You can use this data to create content that truly resonates with your audience.
The YouTube algorithm may feel like a puzzle, but one thing is clear—your content format plays a big role in engagement.
For example, you might find that reaction videos perform better than explainer videos.
YouTube analytics can help you figure out what type of content truly connects with your audience.
Your video content is just one part of the bigger picture. Elements like thumbnails, captions, hashtags, and channel branding also affect performance.
Check your analytics dashboard to see how these details influence your channel’s success.
You can’t access YouTube analytics for other channels directly through your YouTube Studio, but you can find out what other content your audience is watching.
You just need to head over to your channel’s Audience tab and check out these two metrics—
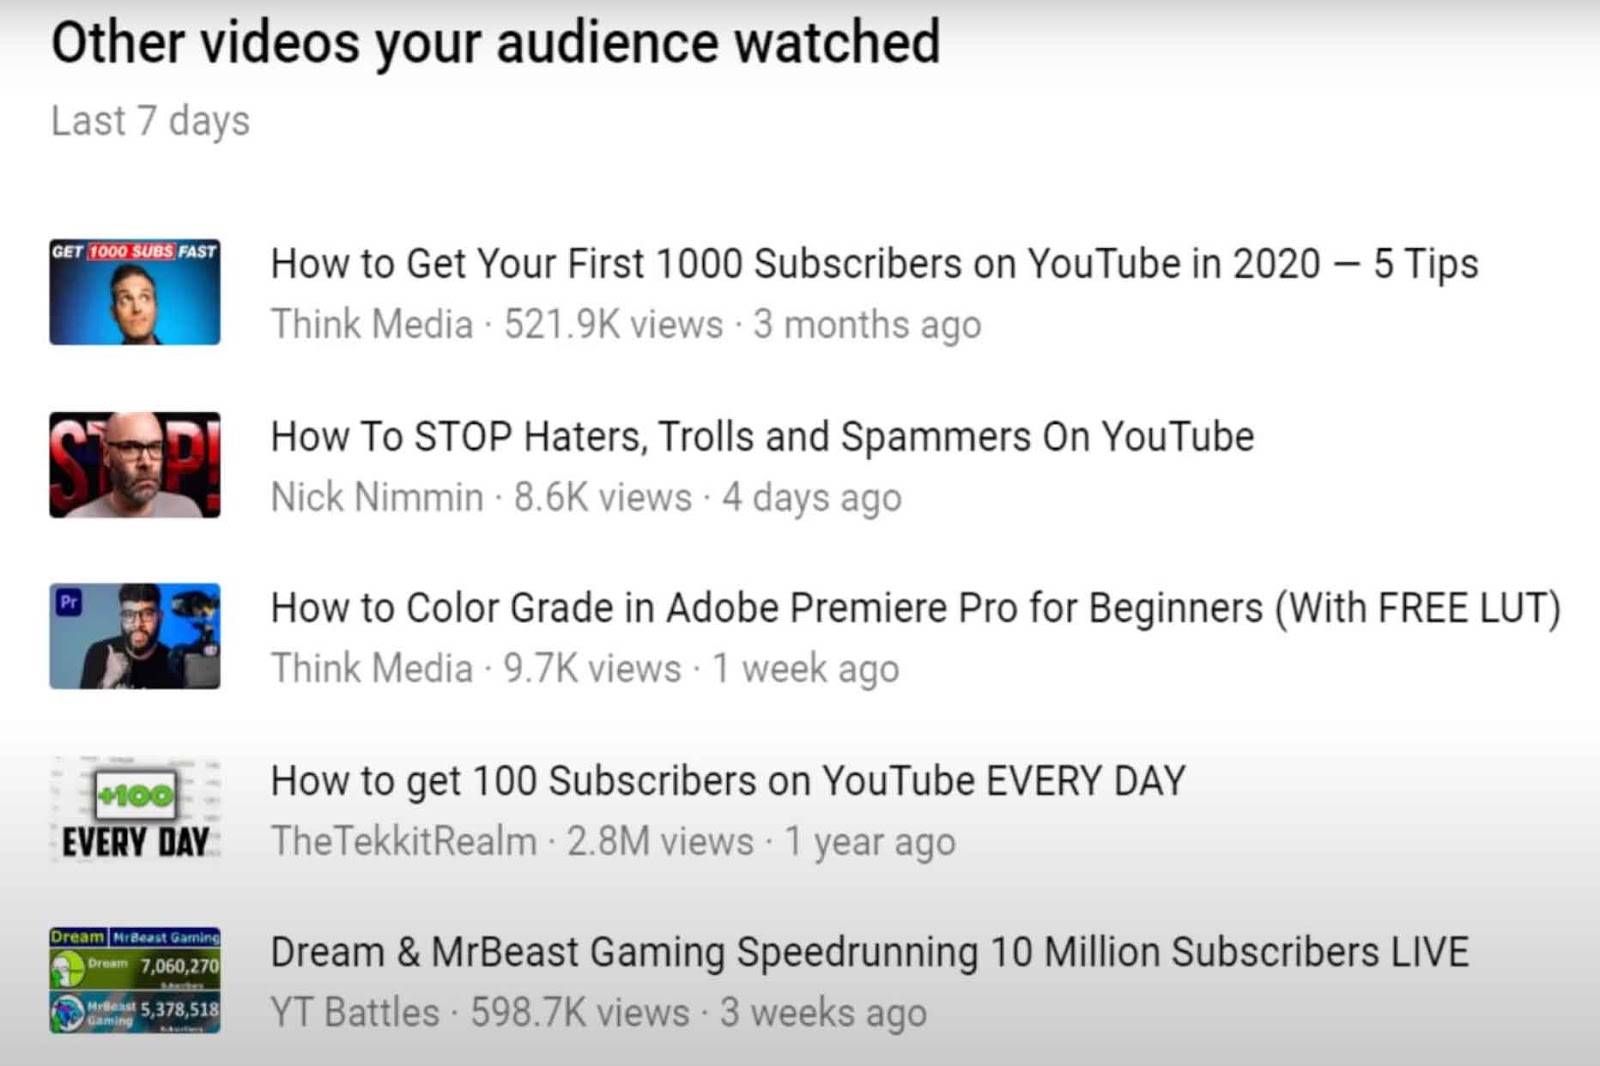
Source: VidIQ
This will show you what your viewers are watching when they’re not on your channel. You can use this insight to get ideas for your own content, potential collaborations, or even inspiration for thumbnails.

Source: Search Engine Journal
This report helps you see the other channels your audience is most interested in. You can apply the same strategy here—gather ideas or explore collaboration opportunities.
To compare multiple YouTube accounts, including competitors' analytics, you’ll need to start using third-party tools.
As a B2B marketer when deciding how often to check your YouTube data, think about these points–
For instance, if you're running an ad campaign, you’ll probably want to check in daily, or at least weekly, depending on how quickly you can adjust things like underperforming videos.
However, some metrics, like subscriber growth, take longer to analyze since they show long-term engagement. Metrics like watch time and engagement may need weeks or even months before you can draw any big conclusions.
Here’s a simple approach you can use to track the metrics-
And that wraps up our blog on YouTube metrics and KPIs!
We’ve covered how, beyond the usual metrics like shares, comments, and views, there are deeper insights you can tap into to really understand what your audience loves—or doesn’t.
You just need to understand what each metric means, regularly track them with YouTube analytics tools, and spot patterns—like which content gets more likes or holds viewers’ attention longer. With this data, you can tweak your strategy and make the most of your videos.


No Comments Yet
Let us know what you think